In step 1 you navigate to your area of interest and select the subsurface model you wish to view on the map. Via the selected model you can drill down into the subsurface at a certain point or create a cross section. Additionally, you can request information on the borehole logs used to create the model.
Content tool bar
In step 1 the following functions are available:
Your legend: The legend explains the added symbols displayed on the map. It is activated by selecting at least one model. Click the Your legend button to expand or collapse the legend.
Cross section: A cross section cuts through the active model along a chosen line. Clicking activates the functionality for one-off use. To create a section at a different location, click this button once more.
Synthetic borehole: The synthetic borehole drills through the model at a particular point. Click to activate the functionality for one-off use. To use the synthetic borehole at a different location, click this button once more.
Navigating the map
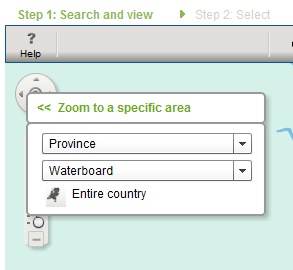
Navigation options: zoom to a predefined area
You can navigate the map in two ways. These options are both shown top left on the map:
- Zoom in and out on the map, using the zoom options (scroll with the mouse, using the zoom bar on the left of the map); move the map (drag with the mouse, or use the navigation wheel on the left of the map).
- Zoom to a specific area. To do so, click on the centre of the navigation wheel to bring up a menu in which you can choose between three different administrative areas:
- Province
- Water board
- Entire country
Make your selection from the drop-down menu or by clicking the Entire country button. The map will zoom in or out to the selected area. Clicking on << or next to the menu will cause the menu to disappear.
Select data
In step 1 you select the subsurface model you wish to view and might wish to order later. Once you have selected a model, its outline is displayed on the map, as well as the locations of the borehole logs used to create it.
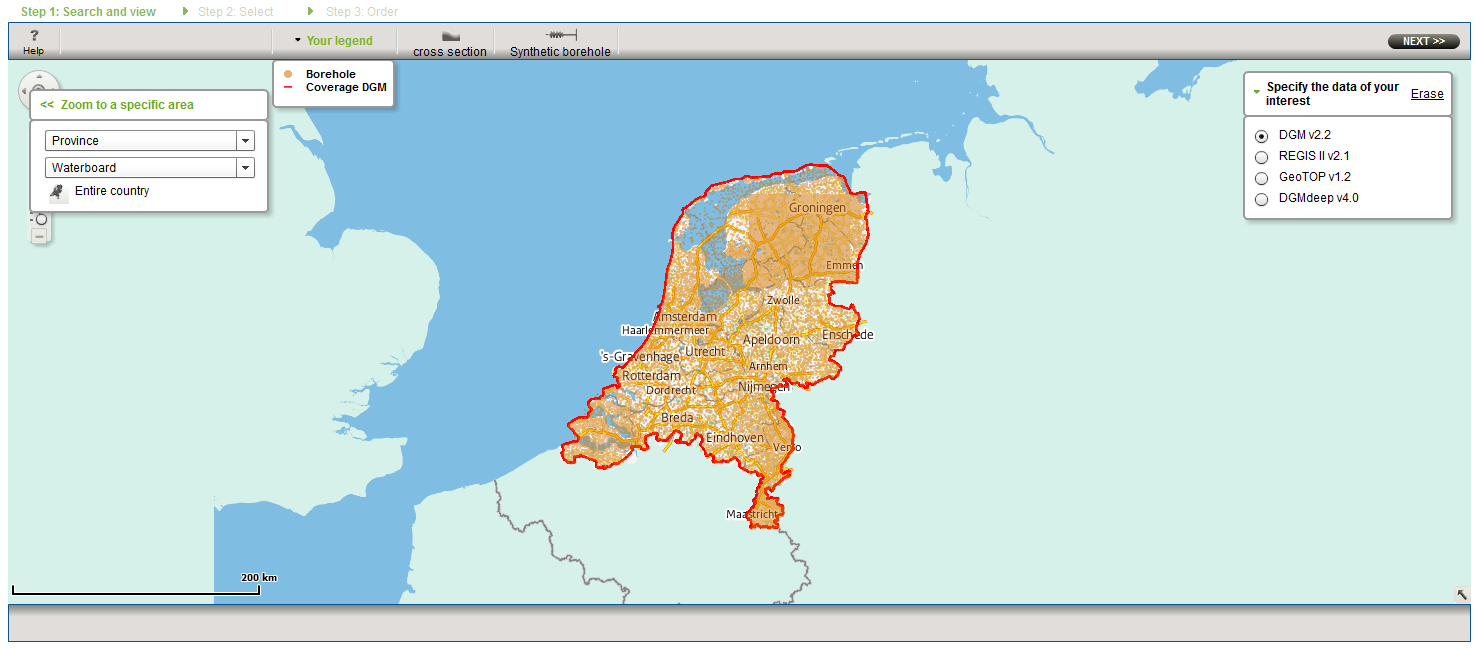
Select the subsurface model you wish to view
Visualisations of borehole logs used to create the models
Once you have selected a model, the borehole logs used to create it will be displayed within its outline. Zoom in to activate them. For more information, click on the borehole location: this will bring up a visualisation of the lithology and interpretations of the log that are specific for the model.
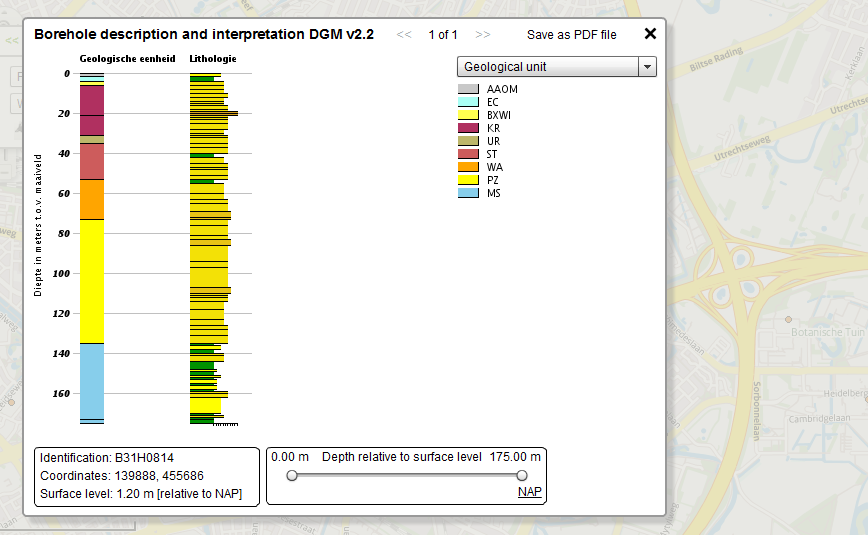
Example of a visualisation of a borehole log used in DGM. Hover with the mouse to obtain more information. The EXPLANATION tab provides details on the information shown.
Visualise the model by making a cross section
To make a cross section of the model, draw a line on the map by clicking with the mouse. Use a click to change the direction of the cross section. A double click closes the cross section. If you click on a location of a borehole log that has been used to make the model, this location will be displayed on the line as a black circle. The location and depth range of the borehole logs are displayed in the cross section.
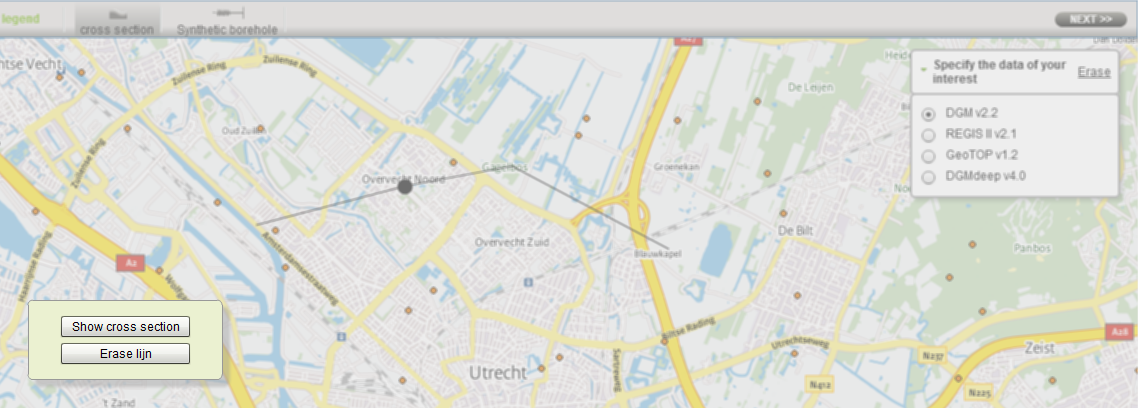
Line drown to create a cross section. If you have included locations of a borehole these are marked with a black circle.
After you have completed the line (double click) you have the choice of drawing the cross section (“toon doorsnede”) or erasing the line of the cross section (“wis lijn”). Opting for “wis lijn” will erase the line from the map. If you opt for “toon doorsnede” a cross section is displayed along the line in the model. It may take some time for the cross section to appear, depending on the length of the cross section. You can adjust the depth to which the section is drawn.
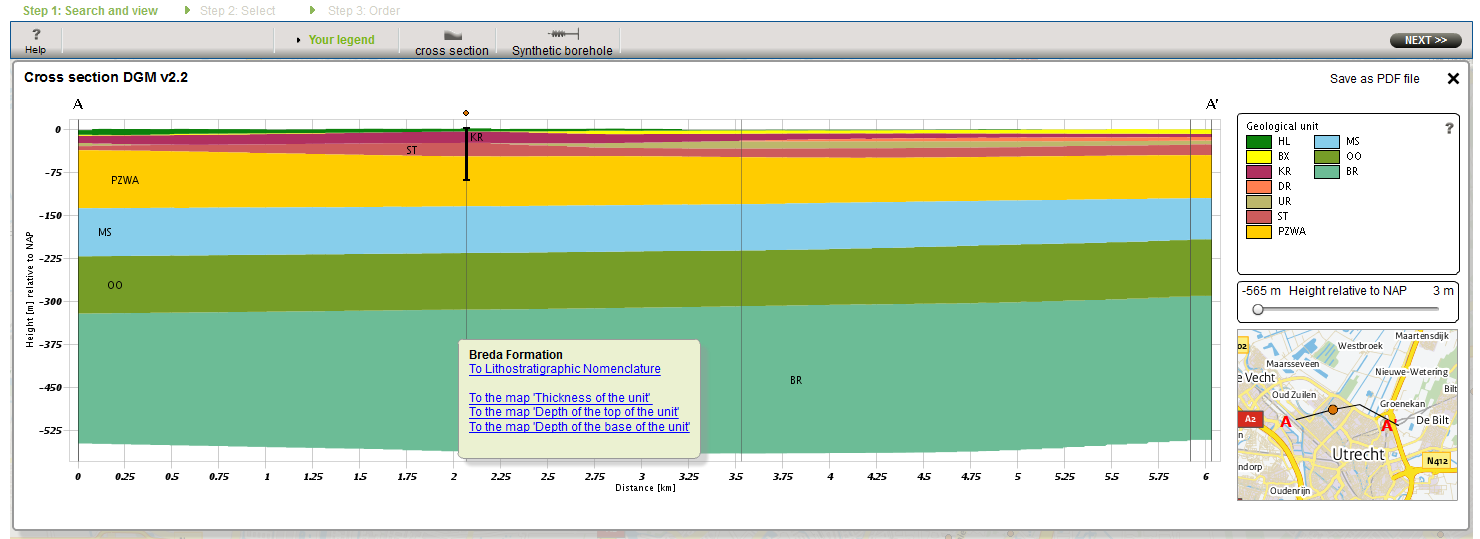
Example of a cross section from DGM. Hover with the mouse to obtain more information.
Hover with the mouse to obtain information about the properties of a specific model layer or Formation (link to the Nomenclature). Or you can generate a new visualisation of the spatial gradients of the top, base or thickness. (This may take some time.) Close the visualisation, return to the cross section and request detailed information on another layer in the model. If you close the cross section you will be returned to the map.
In the GeoTOP model you can select an additional parameter to be displayed in the cross section.
Visualising the model using a synthetic borehole
Click on a random location in the model area to generate a visualisation of the model at that point.
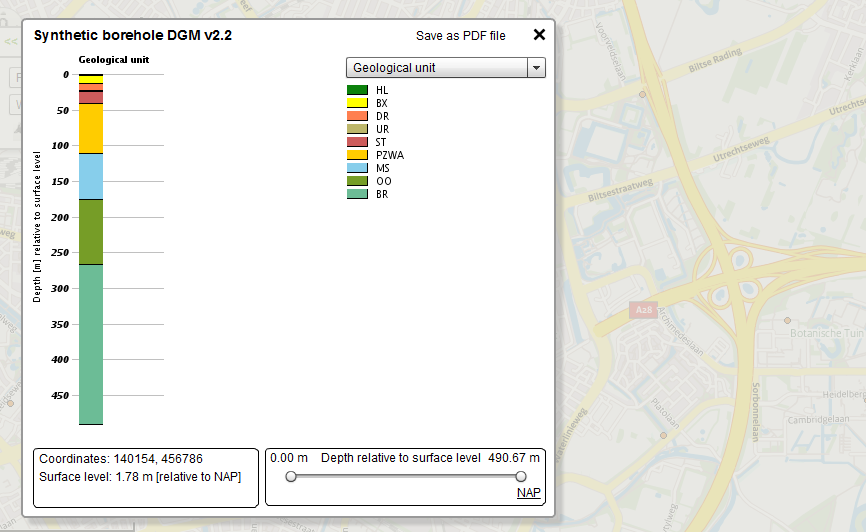
Example of a visualisation of a synthetic borehole from DGM. Hover with the mouse to obtain more information
In this visualisation, you can also switch between Dutch Ordnance Level (NAP) and ground level as a reference. Hovering with the mouse reveals detailed information on the different layers. A link to the Nomenclature gives access to a full description of the selected geological formation.
To the next step
Once you have found your area of interest and you wish to order the available data, click on NEXT >> at the top right in the toolbar to bring up the next window. To select a different area, use the navigation button.