In step 1 the outline of DGM will be displayed on the map, as well as the visualisations of the cross sections, the lithology and the synthetic borehole.
Lithology and interpretation
The visualisation shows the vertical sequence of the lithology (right-hand column) and the lithostratigraphic interpretation of the lithological units (left-hand column).
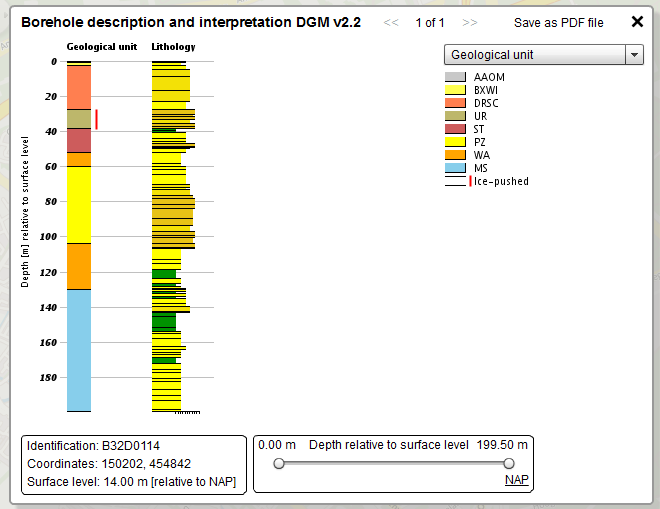
Example of a visualisation of a borehole log used in the DGM model
Synthetic borehole
The synthetic borehole through the DGM layer model shows the vertical sequence of the model units at a selected point on the map. The synthetic borehole provides insight into the depth and thickness of the model units at a certain location. In the visualisation you can switch between Dutch Ordnance Level (NAP) and ground level as a reference.
Uncertainties
The interpretation of the spatially varying model surfaces has uncertainties. These are not displayed in the visualisation with the synthetic borehole. The ArcGIS files of the DGM layer model do provide measures of uncertainty for the model units. As DGM provides estimates of the stacked subsurface layers that are representative for an area of 100 x 100 metres, which fits with a regional scale, the interpretation of a lithology may differ from the interpretation of the synthetic borehole at the same location.
Caveats
Some aspects of the DGM need to be borne in mind when using the model. These “caveats” have been compiled in a shapefile that contains a short description of each point and a document with additional information. These files are updated when necessary. Both files are available in a zip file that you can select when making your order. You can also download the document here.
Viewing the DGM on your own computer
Two shapefiles and five grid files of each model unit in the DGM are available as ArcGIS applications. The files contain information on the distribution, depth and thickness of the unit and thus enable users to analyse and combine the DGM data with their own GIS data.
The ArcGIS files have been put into one zip file that contains the following documents and files:
- ArcMap document “DGM v2.2.1.mxd”, which includes all model units.
- Per unit:
- A shapefile (points) of the borehole logs with a lithostratigraphic interpretation and information on the top, base and thickness of the unit, as well as information on the boreholes that terminate within the unit or extend beyond the base of the unit.
- A shapefile (points) of the borehole logs and lithostratigraphic interpretations in which the unit is absent.
- Grid maps of the top and the base of the unit (in m relative to NAP).
- A grid map of the thickness of the unit (in m).
- Grid maps of the standard deviations of the top, base and thickness of the unit (in m).
- Grid map showing the probability of the occurrence of the unit.
General information that supports the use of the model:
- Outline of all borehole logs and interpretation of the logs (shapefile, polygon).
- Schematic topographic map of the Netherlands (shapefile, polygon).
- Outline of the topographic map sheets. The numbering of the borehole logs has been based on these map sheets.
- Shapefile (polygon) showing the boundaries of the selected area.
- Grid map of the elevation of the ground level and the river or lake bed (in m relative to NAP).
Limitations of ArcGIS
In some parts of the Netherlands a few units are outside the depth range of DGM and for that reason have not been mapped.
The user can open the ArcMAP files in ArcGIS version 10.8.1 or higher. Grid files and shapefiles can be opened in nearly all GIS applications, though sometimes they must first be converted. Examples of alternative GIS packages are Grass (open source), MapInfo and GeoMedia.